An Interesting Alteration of Gamma Ray Spectra for Residual Th Isotopes
Observed in the Large Scale Yeast Experiment
N. A. Reiter and Dr. S.P. Faile
29 September 2003
Protocol:
In August of 2003, the opportunity arose for some analytical time on the low temperature germanium gamma ray spectrometer at the University of Toledo physics department. We used this opportunity to examine the gamma ray spectra of three samples containing thorium nitrate. Two of these samples were selected from discrete stages in our processing of yeast/soy milk media, as reported in our fifth report on possible biological transmutation. The third sample, as a control, consisted of 50 ml of a saturated solution of thorium nitrate in distilled water.
By EDS, we had previously acquired evidence for the presence of several elements in the thorium nitrate enriched organic matrix that had not been present in the initial preparation. These, we suggest, may likely be the product of unique transmutative processes in the yeast culture. Our objective in this case was to look for any evidence of nuclear activity in the yeast culture based on alterations in gamma ray spectra from a known control.
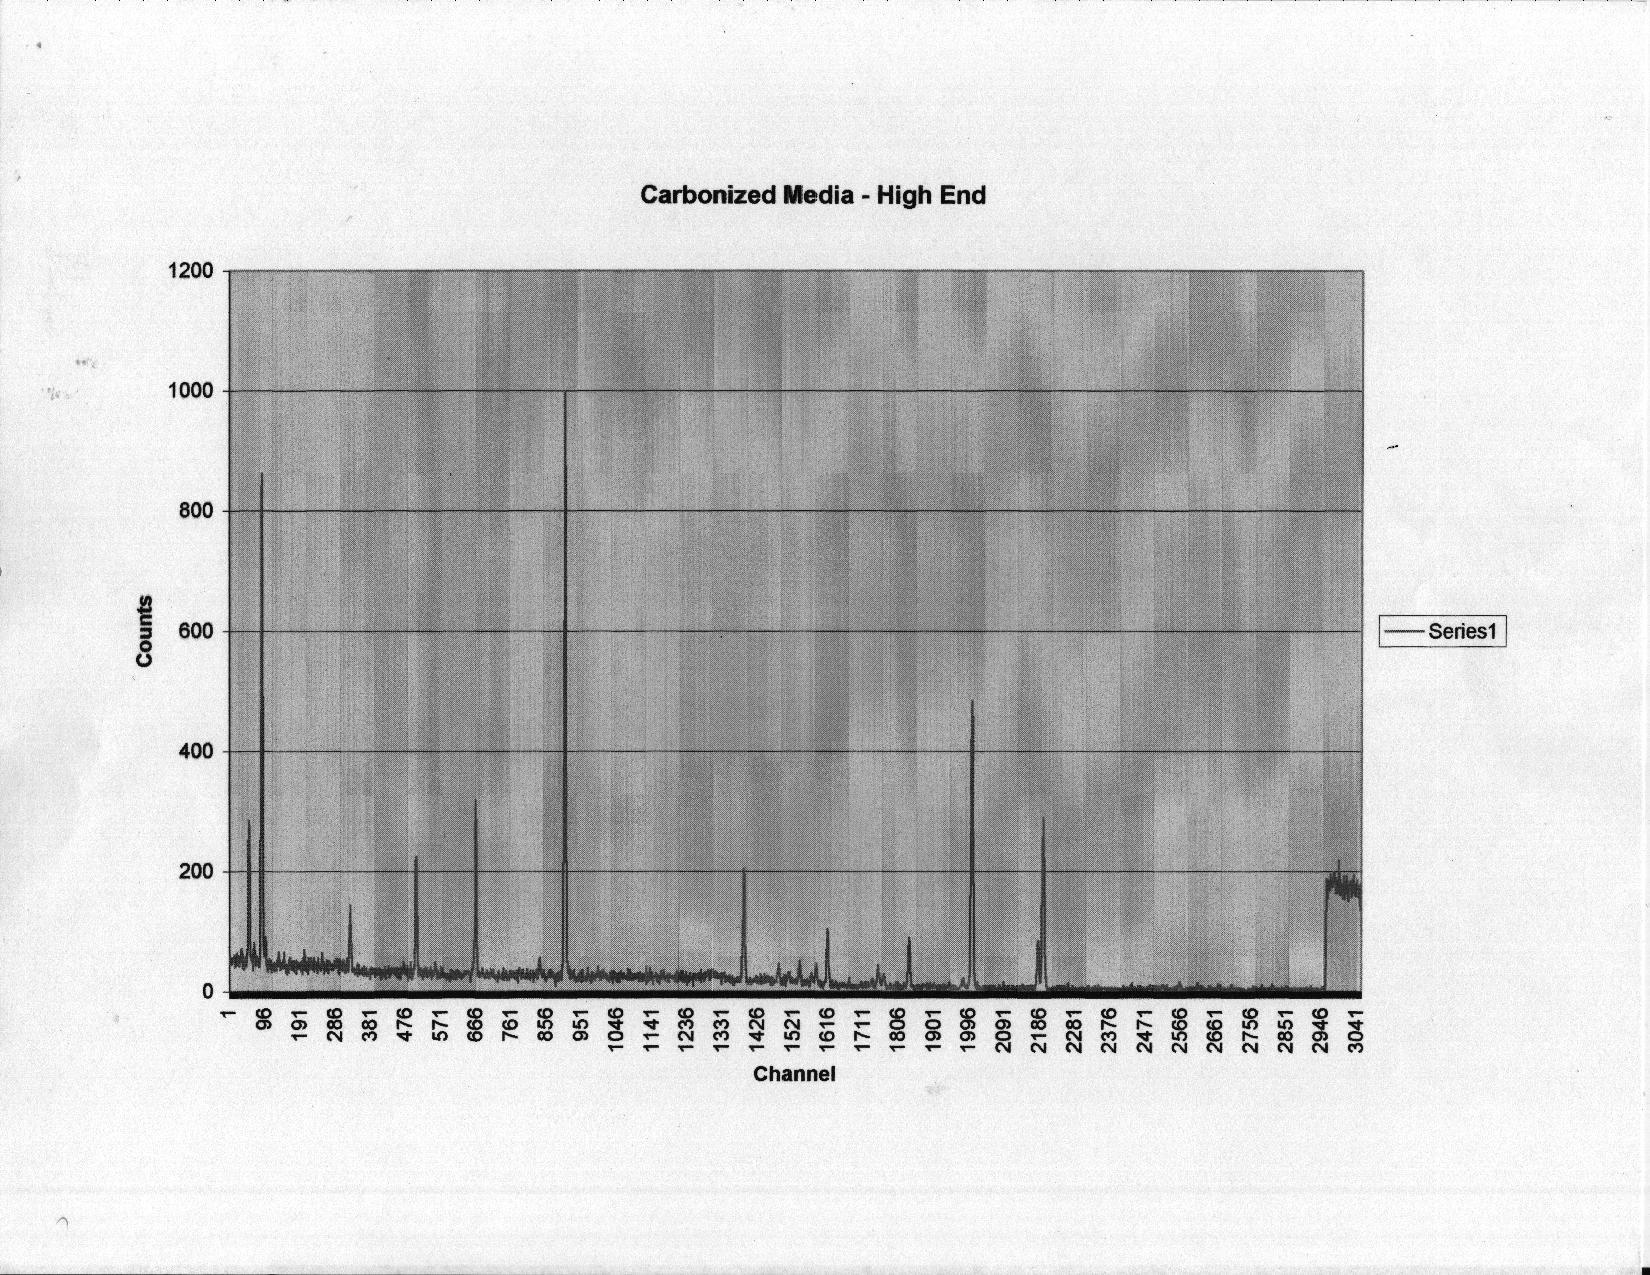
The system, an EG&G Ortec "Pop Top" photon counter was chilled with LN six hours ahead of time. The unit was examined by the head of the department, and was confirmed to be operational. Following some unrelated analysis of 231Am samples, we set up our Th containing samples one at a time, and recorded the gamma ray spectra for each, over a five minute acquisition time. Spacing from the detector head was kept at approximately 5mm. All three samples were in identical Nalgene bottles.
The three samples examined were:
Results:
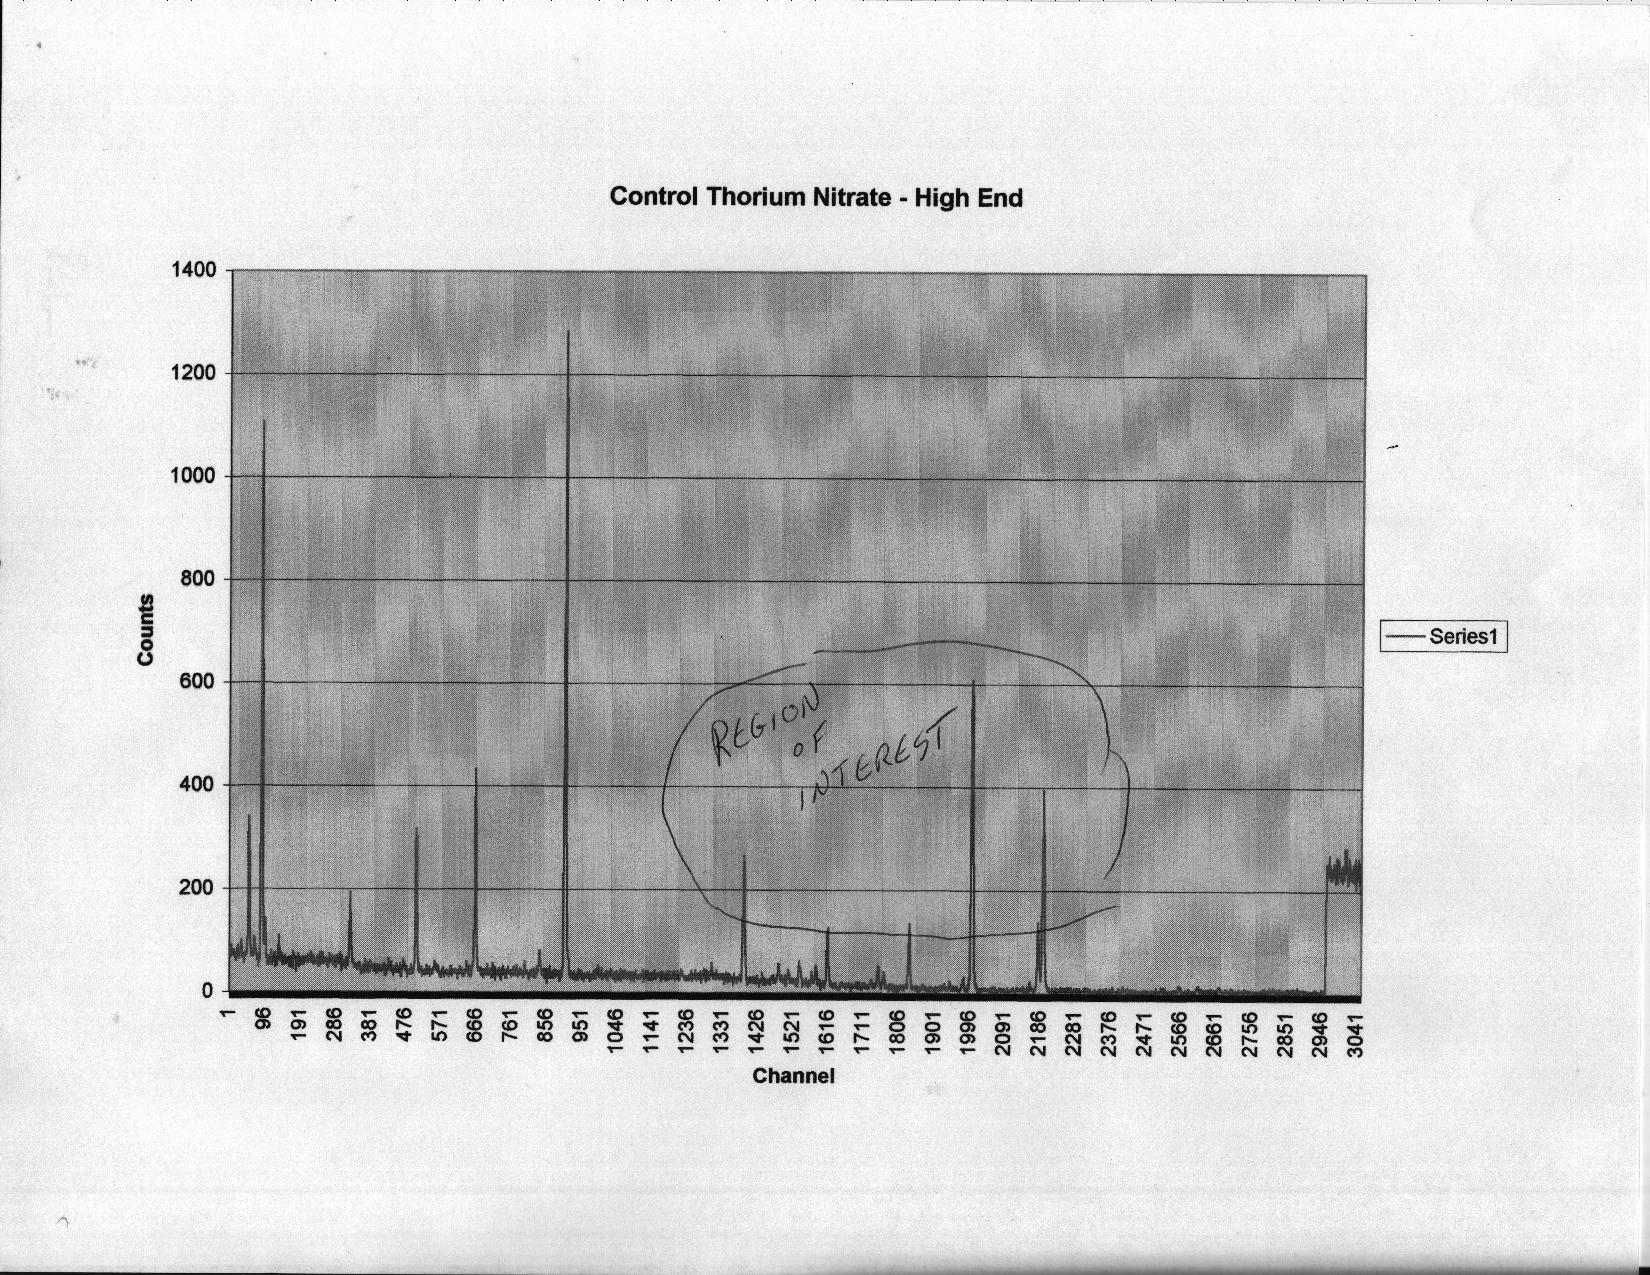
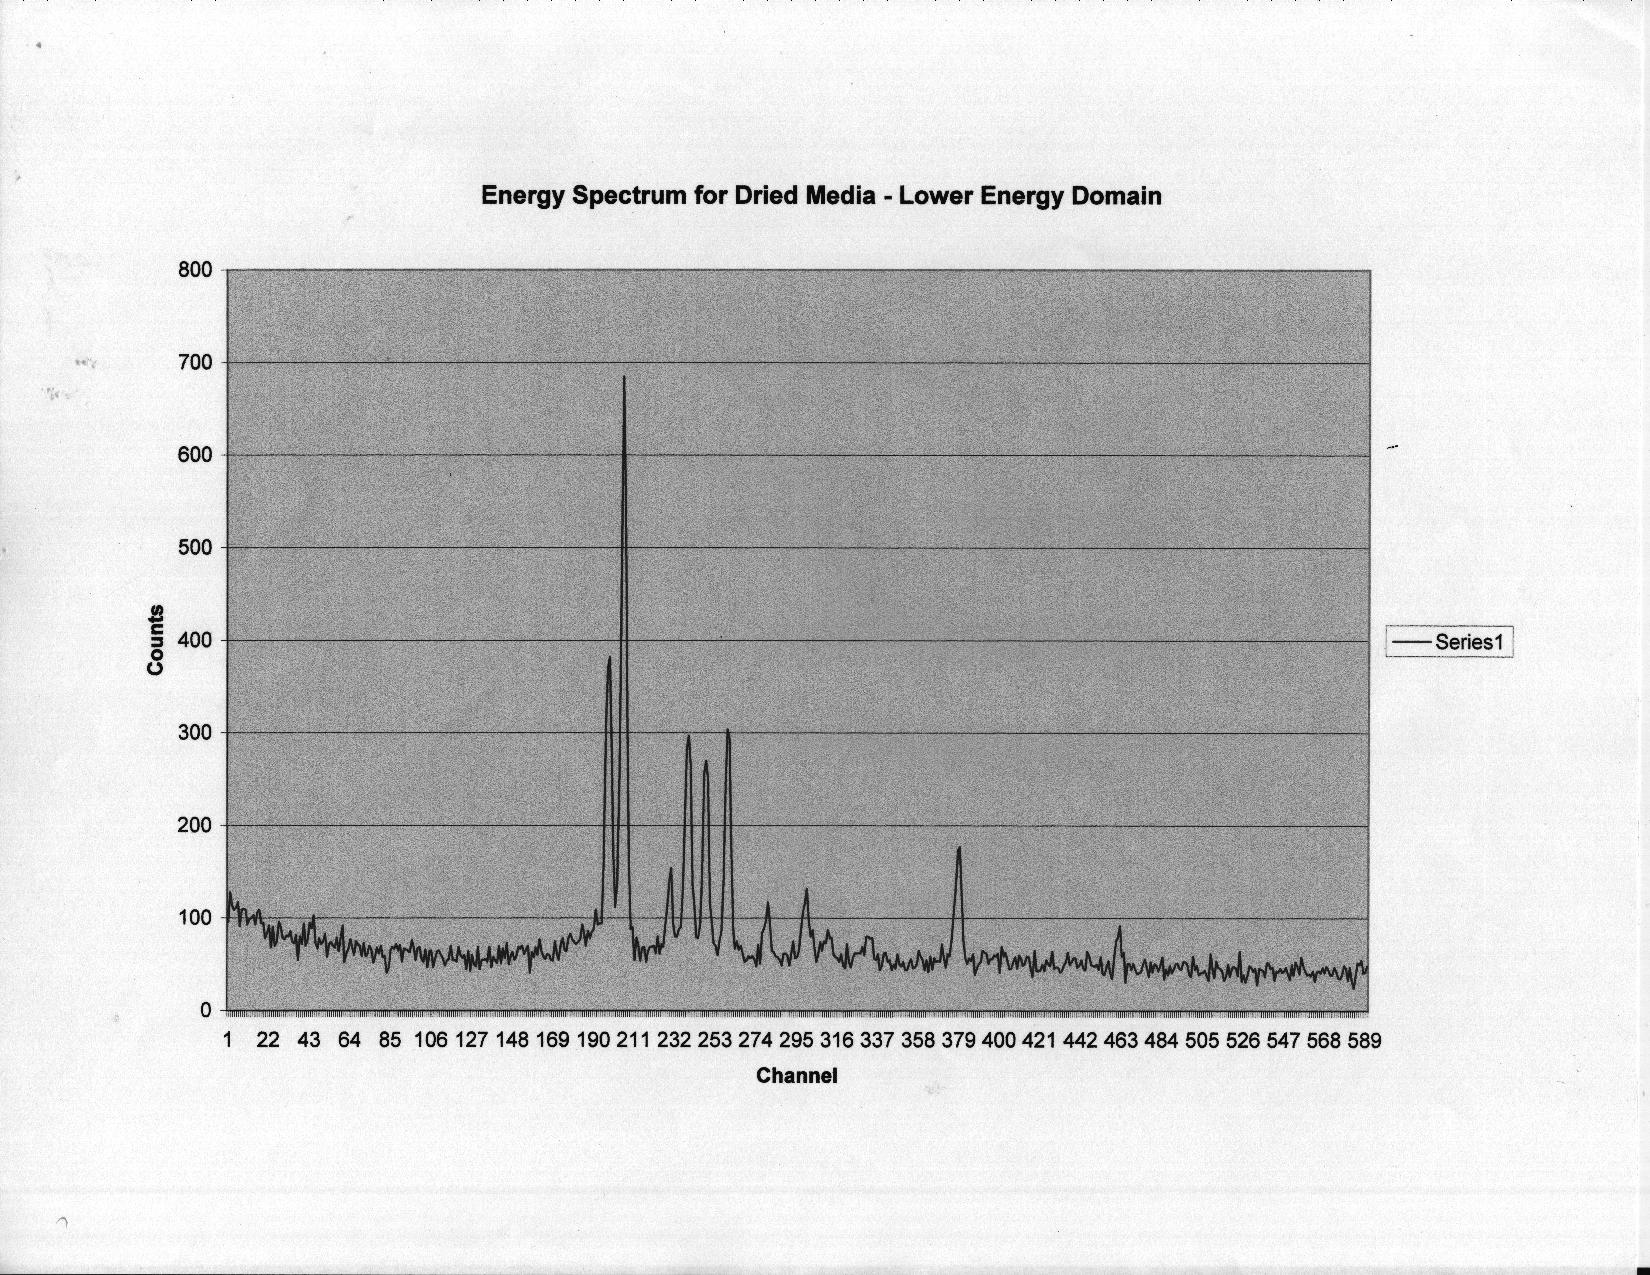
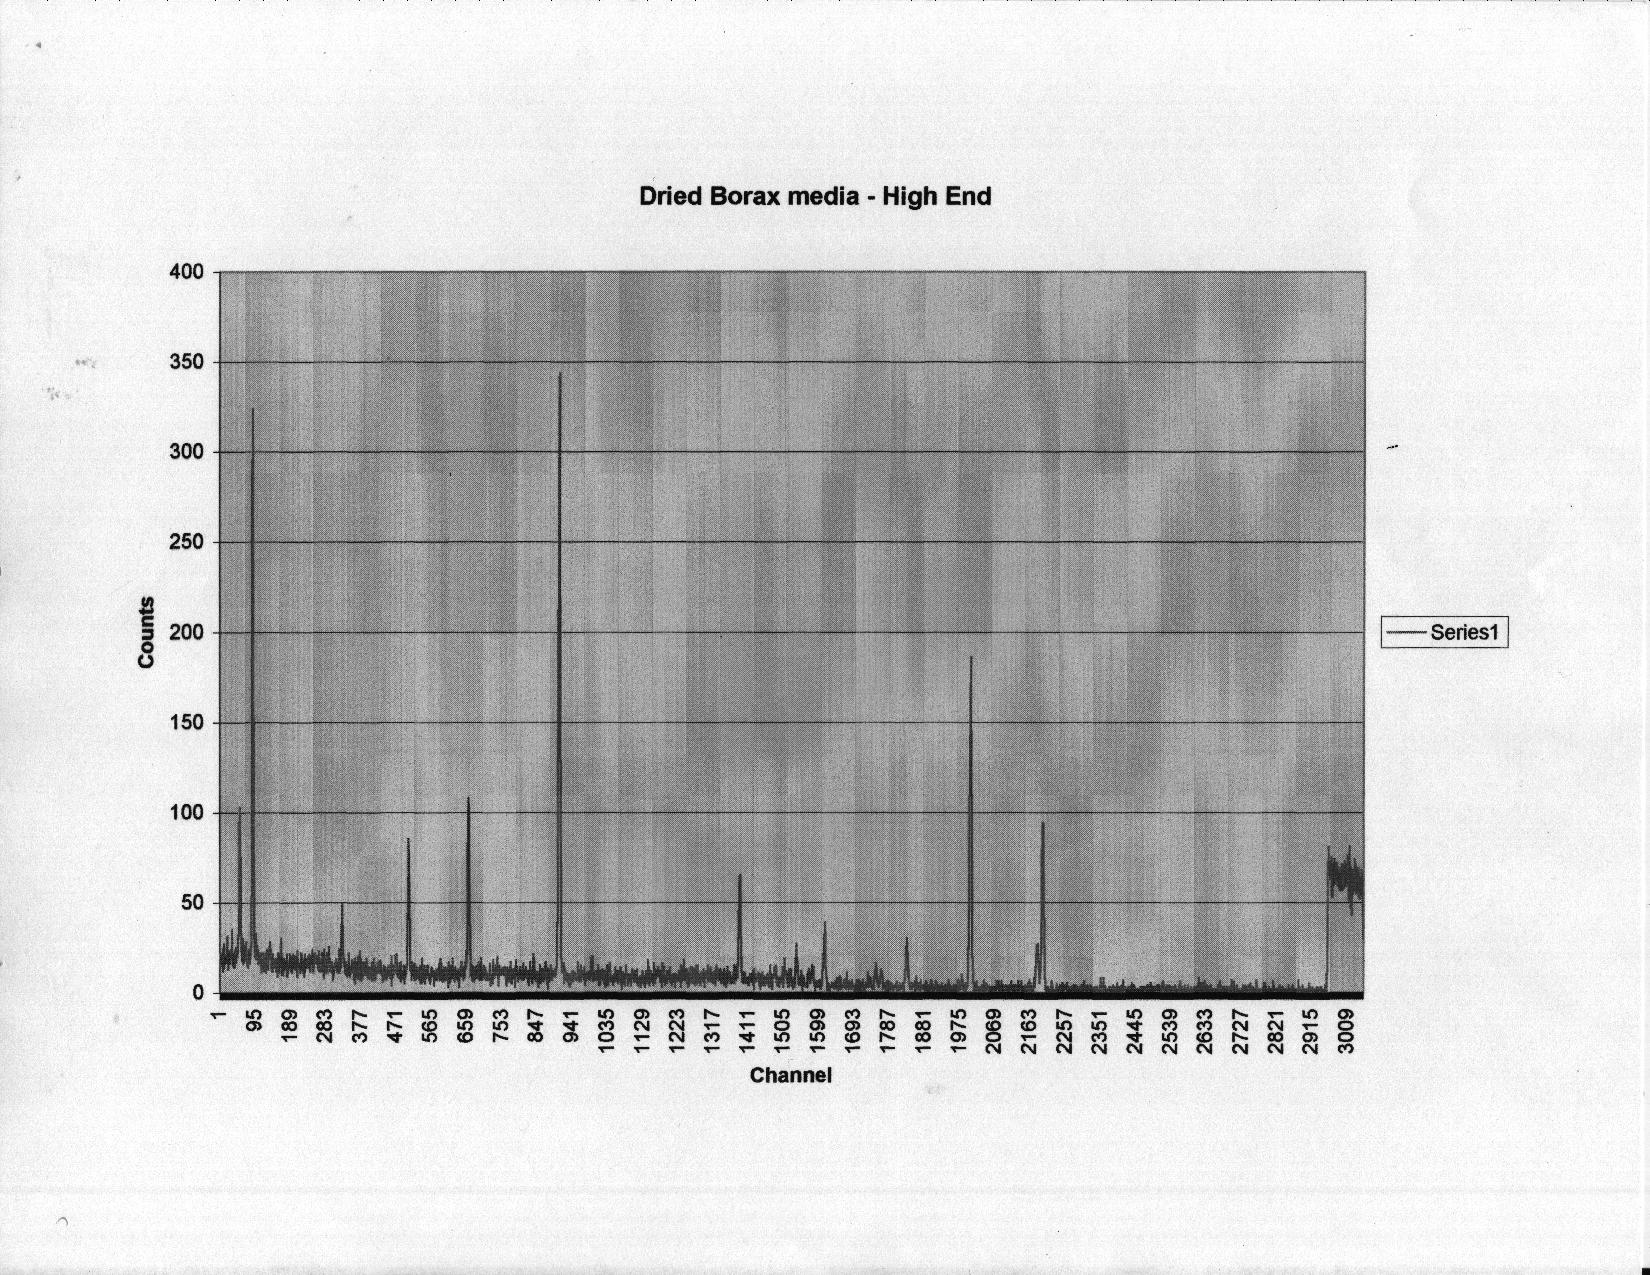
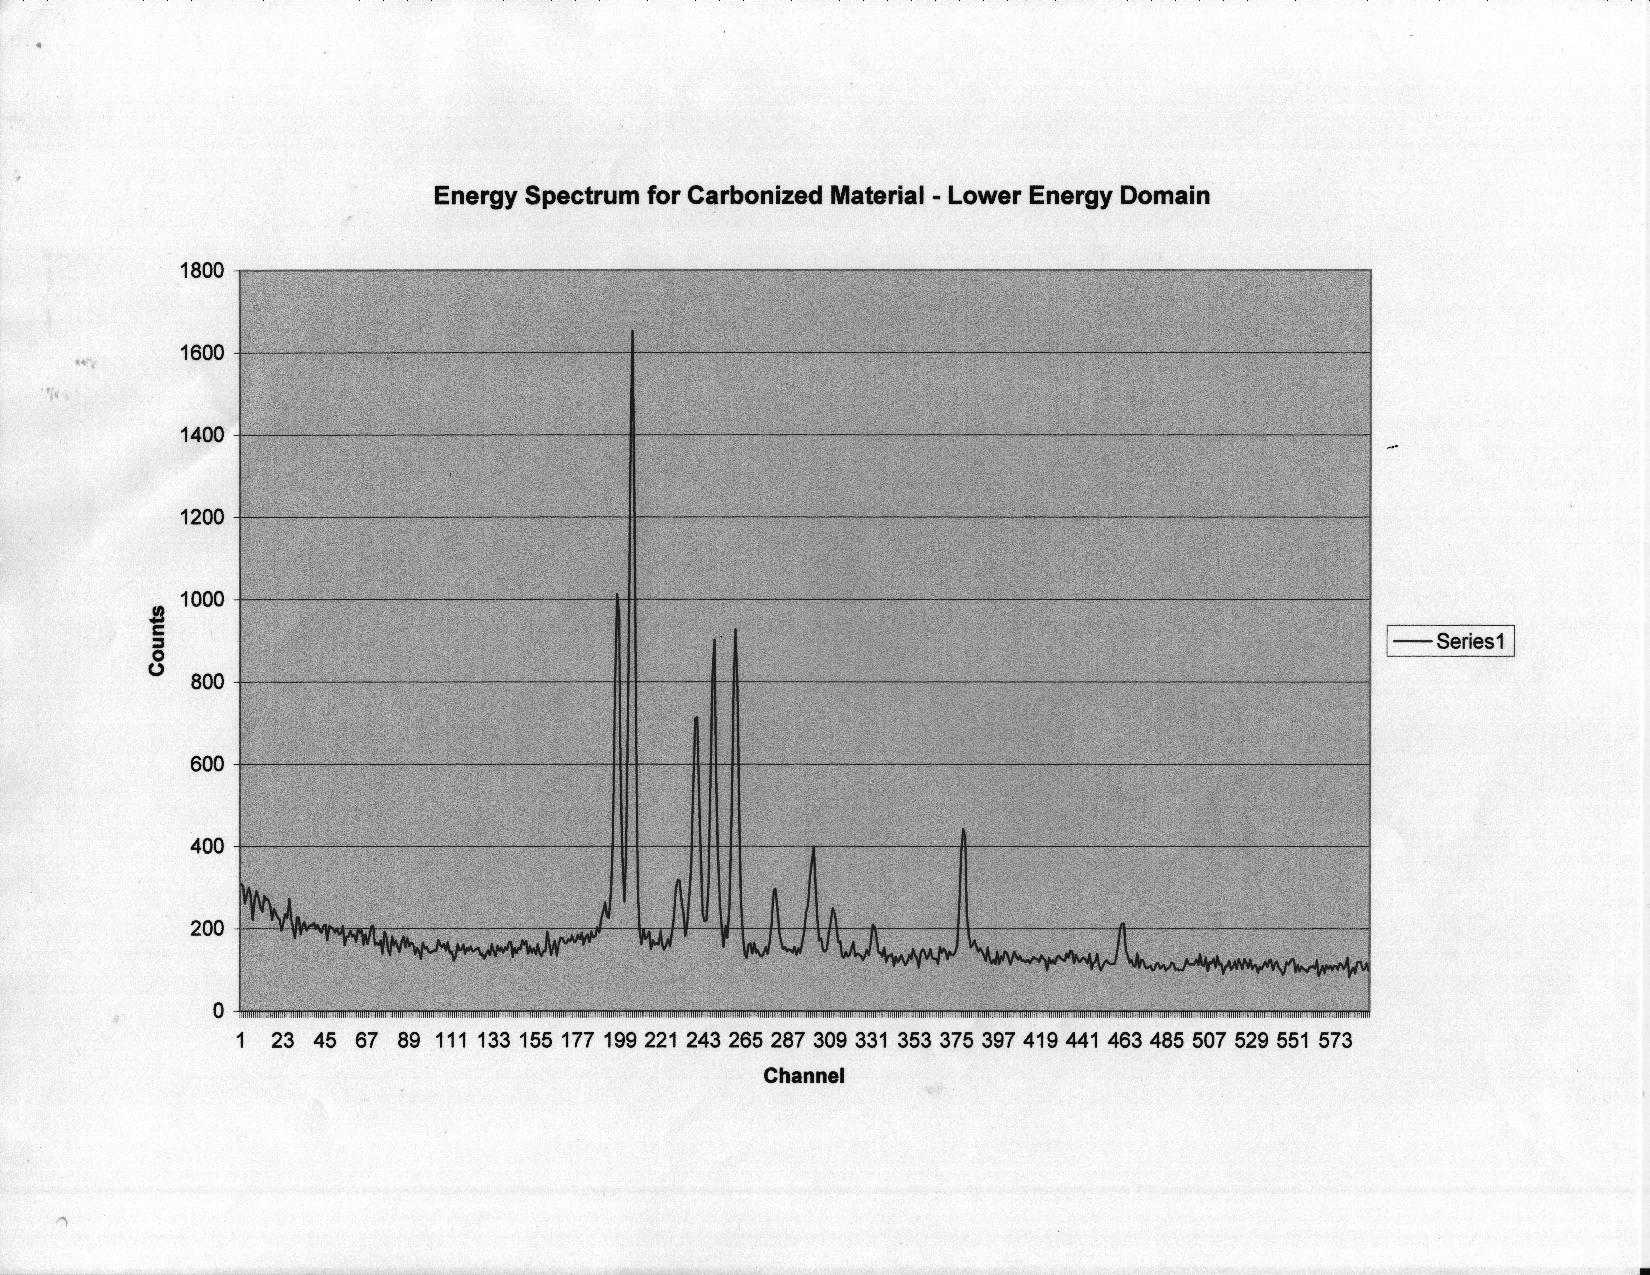
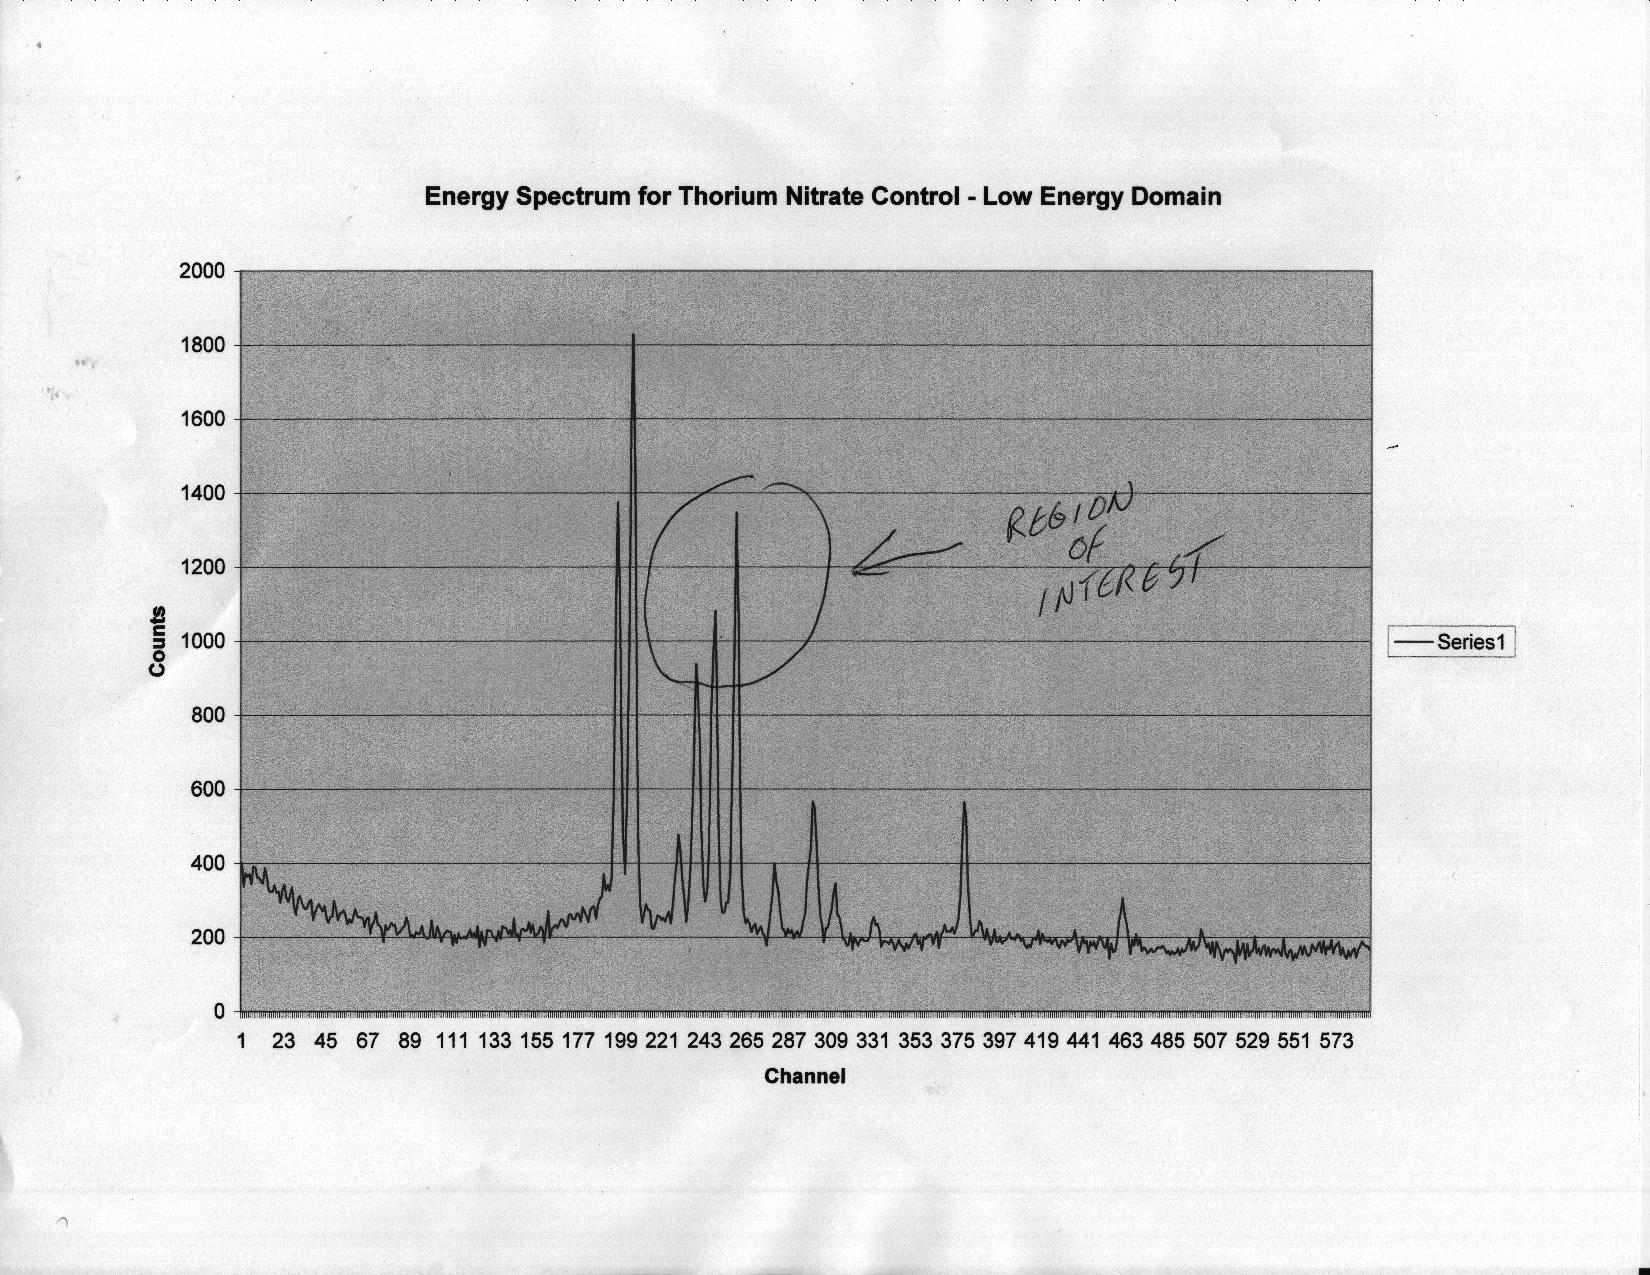
The acquired gamma ray spectra were interpreted by the system software and plotted with respect to detector channels. Unfortunately, the early vintage of the software did not provide a translation into an actual scale calibrated in eV! Instead, one is forced to interpolate peak positions from known reference data and calibration samples. However, we were more interested in comparing spectra.
The reader may note from the accompanying plots that with respect to energy positions, the three spectra are nearly identical. However, close inspection will reveal that an interesting phenomenon occurs, such that relative magnitudes of some peaks are different from plot to plot. Some peaks are subdued and others are enhanced, relative to their neighbors.
An intensive search of reference data tells us that two isotopes of Th contain most of the powerful gamma ray energies. 232Th with a half-life of 1.41E10 years exhibits a single strong, soft gamma ray line at 59 keV. However, we find that the much shorter half- lived 233Th (22.2 minutes) contains a broad range of gamma ray emission, with the greatest peaks at 86, 441, 459, and 669 keV
Two general regions of interest exist, wherein may be seen the peak differentials. The low-end region appears to be between 80 and 100 keV. It is this lower energy range that is of particular interest, exhibiting the greatest differences in peak height ratios. From our interpolations, the higher energy region of interest seems to be around the mid 400 keV range.
We are still attempting to correlate some of the detected gamma ray peaks with emission from other elemental species. 188Re (half -life = 16.7 hours) has a strong emission at about 85 keV. 187W, with a half-life of 24 hours emits at 480 keV, and 102Rh with a half-life of 2.9 years emits at 475 keV.
On the other hand, we see that there do not appear to be any gamma ray peaks on the plots for either the carbonized or dried experiment media that do not also appear on the plot for the control solution. Could it be possible, though, that the reason for some of the peak height shifting might be an overlay phenomenon, where a peak for 188Re for example, might lie on top of a Th peak, thus adding to the amplitude of that energy line as read by the detector?
It is difficult to state clearly at this time what our gamma ray spectra are trying to tell us. However, it does seem likely that we are observing effects of nuclear alteration, active within our biological media.