Keywords: National Pain Institute, electromagnetic pulse, clinical tests, rats& mice, Wister mice, Balb-C mice. Clinical Tests involving Rats and Mice
5th PROTOCOL I. INTRODUCTION The experiments to determine the effects of electromagnetic pulses with the PAP-IMI-300 Device in healthy as well as tumor bearing animals started about two years ago. Before we applied electromagnetic pulses to any tumor treatment we performed a series of experiment to investigate the possibility that EMP would affect normal subjects.
II. STUDY DESIGN A. Animal selection
1. 384 wistar rates were included (in groups of 32) in EMP studies 2. 120 Balb-c mice were included (in groups of 10) in EMP studies 3. 100 wistar rats were included (in groups of 20) as placebo.
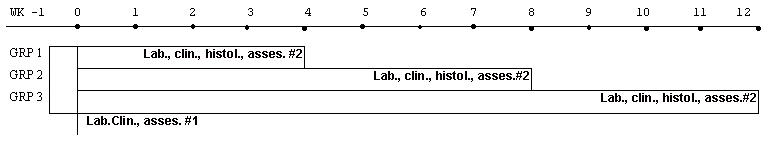
Using the PAP-IMI-300 Device with the probe facing flat, and the animals in 8 cm distance, about 7 joules of energy per pulse and at a rate of about 5 pulses per second the animals were exposed every second day, for a period ranging from one to three months (see tables I , II , III ). - (Click on the Table number to get there) The animals were placed in groups of four, in a special device constructed for that purpose, the current applied and the energy dose regulated through a special knob on the PAP-IMI-300 Device. Animals which served as controls were handled the same way, placed in a similar device with the only exception that there was no current applied to it. This was in order to evaluate any symptom that might appeared from the repeated handling of the animals and would not be connected with the electromagnetic energy.
IV. OBSERVATIONS and EXAMINATIONS a. Behavior The animals were observed very carefully, daily, for any symptoms of behavior or any other adverse event. Any animal that would die for any reason would be autopsied and the appropriate organs taken for pathologic examination. The investigator would assess any adverse event and record it in detail including the date of occurrence, time of onset, severity, duration and outcome and whether it could be attributed to the study treatment. The severity of a clinical adverse event was graded using the following definitions. NONE: No clinical adverse event occurred. MILD: The adverse event was transient and easily tolerated. No special treatment was needed for symptomatic relief. MODERATE: The adverse event caused discomfort and interfered with the normal life of the animal. SEVERE: The adverse event caused considerable interference with the life of the animal and special treatment might occur. The relationship of all adverse events to the study was assessed using the following definitions. NOT RELATED: Evidence existed that the adverse event had an etiology other than the treatment. POSSIBLE: The adverse event had a timely relationship to the study treatment. However, a potential alternative etiology existed which might be responsible for the adverse event. PROBABLE: The adverse event had a timely relationship to treatment and a potential alternative etiology was not apparent. RELATED: The adverse event had a timely relationship and the treatment was discontinued. A potential alternative etiology was not apparent. If the animal were re-challenged with the treatment the adverse event would recur. b. Laboratory tests Blood was obtained at the beginning of the experiment for the following laboratory determinations. i. Hematology Hemoglobin, hematocrit, erythrocytes and leukocytes with differentials. ii. Blood chemistry
The sera from the group of four animals (treated together) were pooled and the tests performed on the pool. c. At the termination of the experiment blood was obtained for the laboratory determination mentioned above. d. At the termination of the experiment all animals were sacrificed and the following organs obtained for histologic examination.
All the above mentioned laboratory tests were performed on wistar rats only. No laboratory work was done on Balb-c mice. Only behavioral observations were made with Balb-c mice.
V. RESULTS a. Behavior observations During the course of this study one animal in group 5 receiving the 15 min treatment developed an adverse reaction consisting of tremor and unsteady coordination. The animal developed the symptoms 42 days after the beginning of the experiment and the treatment was discontinued. However, the animal continued to live in this condition until the end of the experiment where it was sacrificed along with the other animals. The laboratory findings showed that the level of Triglycerides was elevated well above normals (580 mg/dl). The significant of this observation cannot be, at the present assessed as we do not know how Triglycerides affect wistar rats. During the course two more animals, one from group 2 (10 min exposure) and one from group 6 (10 min exposure) died from some unknown etiology. Neither on autopsy nor on histology there were any findings that would lead to the etiology. b. Laboratory findings Representative sample to blood assessment and chemistry findings appear in tables IV and V respectively. - (Click on the Table number to get there)
The histopathology of all animals has not been completed as this amounts to a large number of specimens and a vast number of microscopic slides. However, a representative sampling from all groups has been studied (an average of three animals from each group) and so far results are negative.
Wistar Rates
Balb-c Mice
Wistar Rats (placebo)
Hematology
Blood Chemistry
|
|||||||||||||||||||||||||||||||||||||||||||||||||||||||||||||||||||||||||||||||||||||||||||||||||||||||||||||||||||||||||||||||||||||||||||||||||||||||||||||||||||||||||||||||||||||||||||||||||||||||||||||||||||||||||||||||||||||